728x90
0. 패키지 및 데이터 불러오기
import seaborn as sns

tips = sns.load_dataset("tips")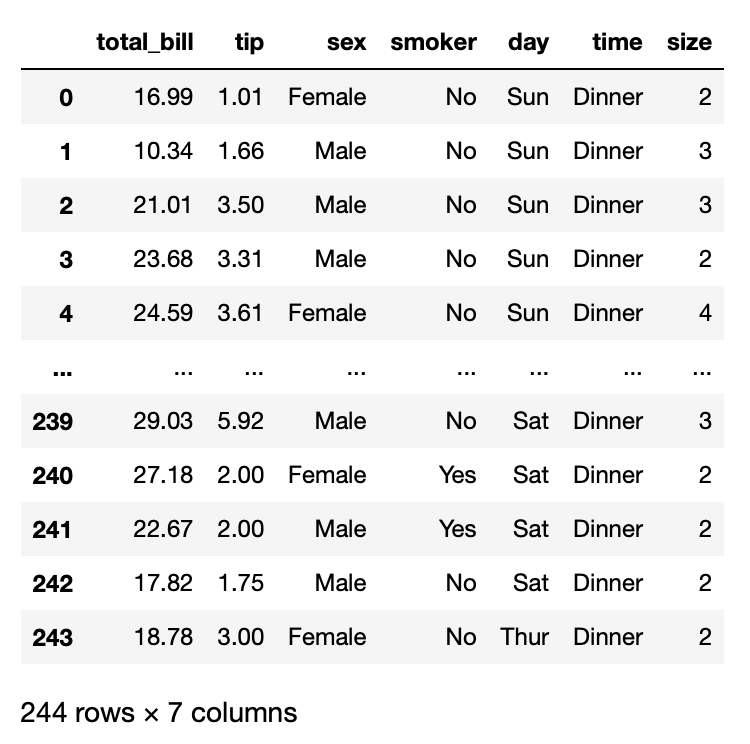
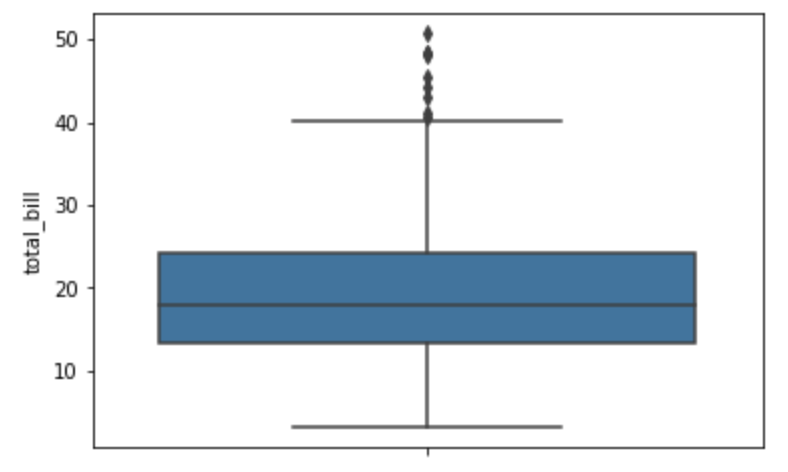
1. 기본 가로형 세로형 Boxplot 그리기
ax1 = sns.boxplot(x=tips["total_bill"]) # 가로형 boxplot, orient="h" 명시적으로 설정 가능ax2 = sns.boxplot(x="total_bill", orient="v", data=tips) # 세로형 boxplot

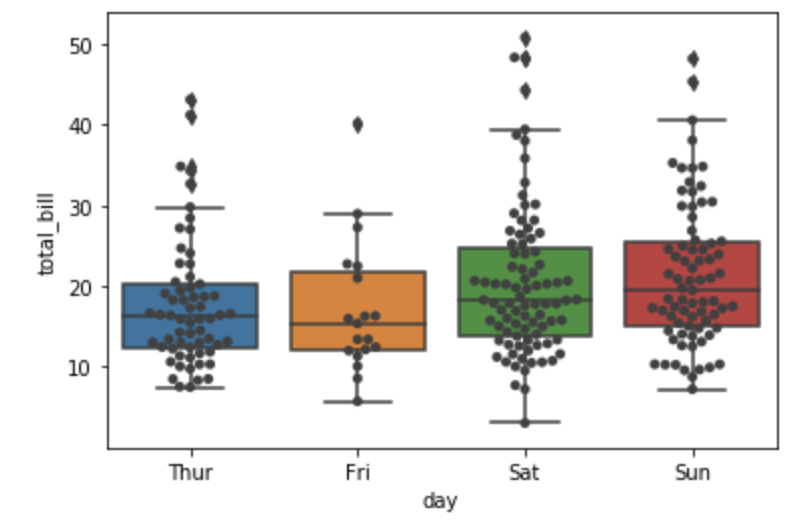
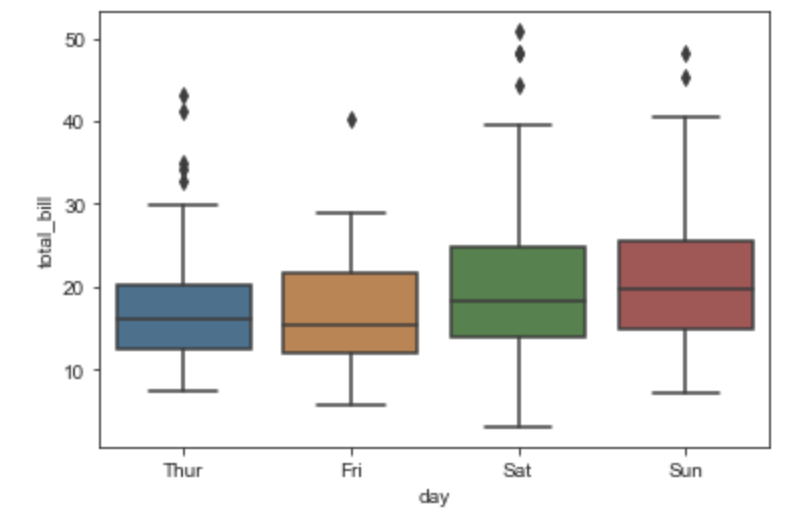
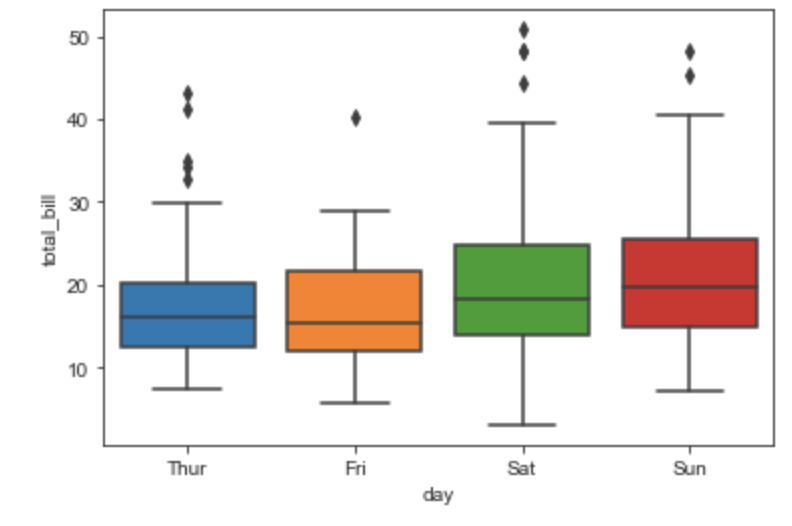
2. 집단별 Boxplot 그리기
ax = sns.boxplot(x="day", y="total_bill", data=tips)
ax = sns.swarmplot(x="day", y="total_bill", data=tips, color=".25") # 데이터 포인트 나타내기
3. 이중 집단별 Boxplot 그리기
ax = sns.boxplot(x="day", y="total_bill", hue="smoker", data=tips, palette="Set3")
+ 배경 테마 설정하기
sns.set_style('white') # 흰색 배경
ax1 = sns.boxplot(x="day", y="total_bill", data=tips)
sns.set_style('dark') # 검은색 배경
ax2 = sns.boxplot(x="day", y="total_bill", data=tips)
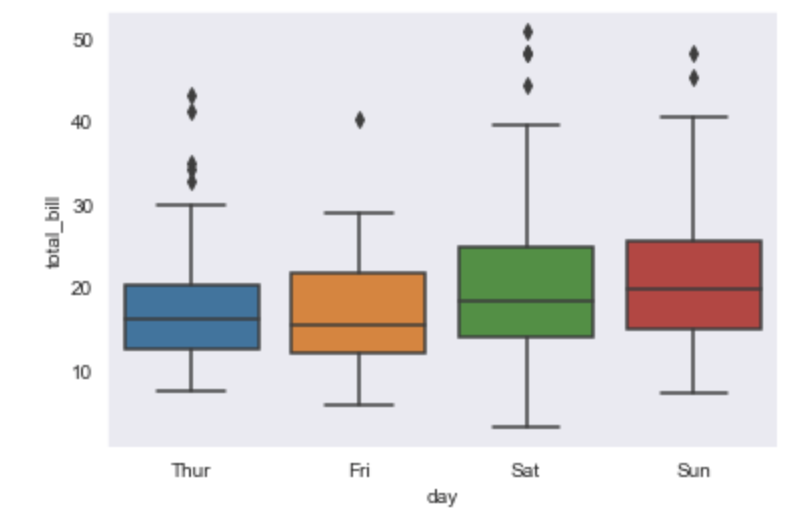
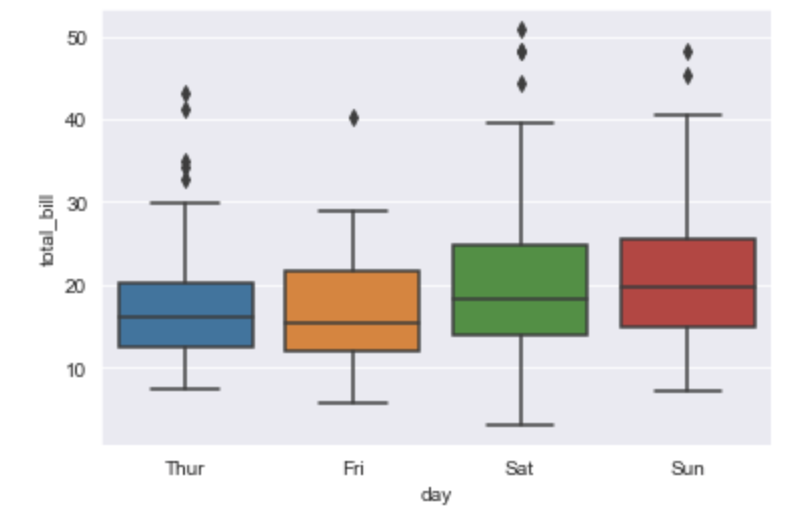
sns.set_style('darkgrid') # 흰색 그리드 배경
ax1 = sns.boxplot(x="day", y="total_bill", data=tips)
sns.set_style('darkgrid') # 검은색 그리드 배경
ax2 = sns.boxplot(x="day", y="total_bill", data=tips)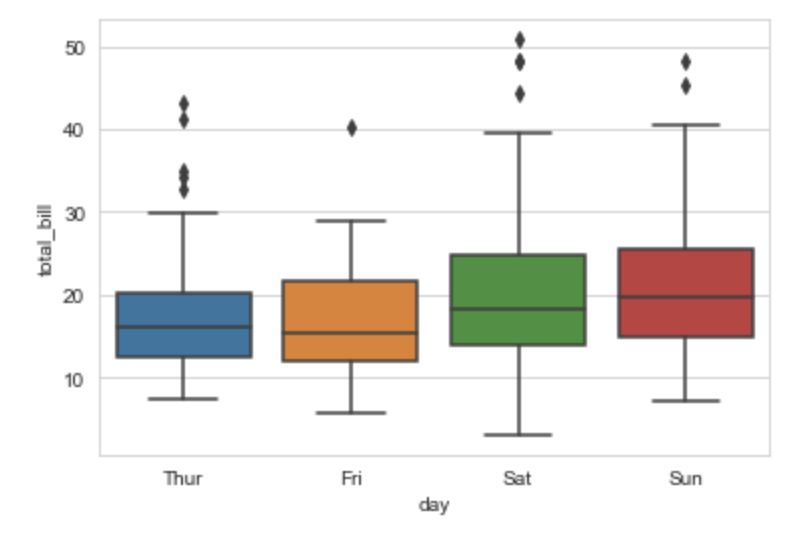
+ 박스 테두리 굵기 설정하기
ax1 = sns.boxplot(x="day", y="total_bill", data=tips)ax2 = sns.boxplot(x="day", y="total_bill", data=tips, linewidth=5.5) # linewidth 지정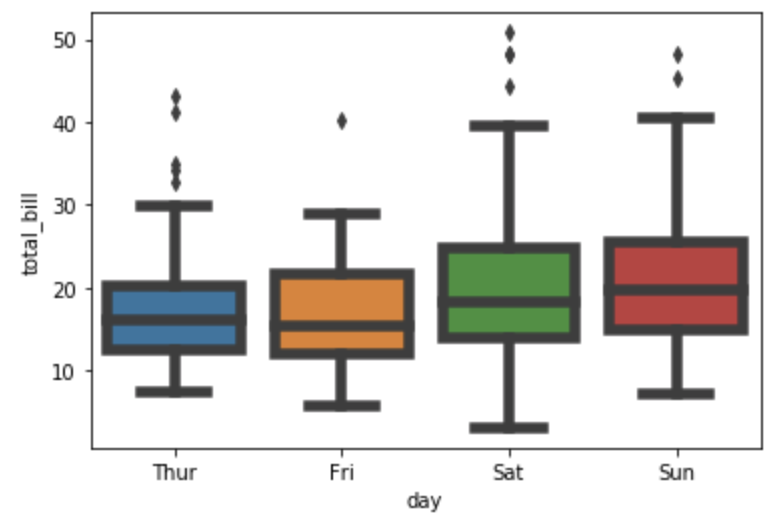
+ 박스 채도 조정하기
ax1 = sns.boxplot(x="day", y="total_bill", data=tips, saturation=0) # saturation 지정
ax2 = sns.boxplot(x="day", y="total_bill", data=tips, saturation=0.5)ax3 = sns.boxplot(x="day", y="total_bill", data=tips, saturation=1)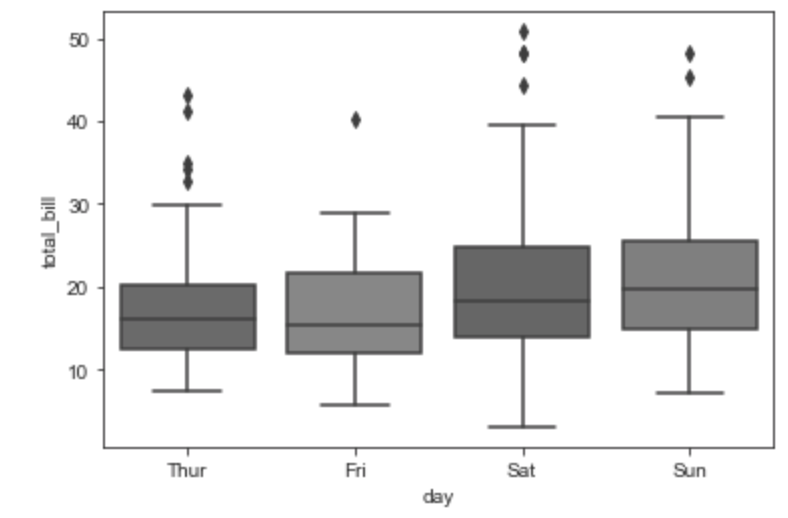
* Seaborn Boxplot 공식 도큐먼트 seaborn.pydata.org/generated/seaborn.boxplot.html
728x90
'데이터 사이언스' 카테고리의 다른 글
| [머신러닝] 배라 아이스크림 종류 구분하는 분류 모델 5분만에 만들기(ft.Teachable Machine) (0) | 2021.10.29 |
|---|---|
| [데이터 사이언스] Seaborn 으로 샘플 데이터셋 가져오기 (0) | 2021.04.24 |
| [데이터 사이언스] DW(데이터웨어하우스)와 DB(데이터베이스)의 비교 (0) | 2021.01.10 |
| [데이터 사이언스] 데이터 분석 및 시각화 프로젝트 아이디어 (0) | 2020.05.22 |
| [데이터 시각화] D3.js로 세계 지도에 국가별 Corona19 코로나 확진자 수 실시간으로 나타내기 (0) | 2020.05.19 |